
Low, Ideal and Excess Stock Coverage: How to Read the Number
July 11, 2026
Stock coverage reads in three bands: low (stockout risk), ideal (the healthy zone you want to live in), and excess (tied-up capital). As a quick rule for most multichannel SKUs: below your replenishment lead time you’re in the low band and should order now; between your lead time and roughly 45–60 days you’re in the ideal band; and above 90 days you enter excess territory, where inventory stops working for you and starts costing you. That’s the number that turns “do I have enough?” into a clear replenishment decision.
But that quick rule is only a starting point, because the bands aren’t universal: they depend on your lead time, the product’s turnover, its seasonality, and the cost of holding it. A stock coverage of 20 days can be perfect for a basic with a local supplier and an emergency for an imported item with a 45-day lead time. The same number, 20 days, reads as low in one case and ideal in the other. Reading stock coverage well means learning to place the bands where they belong for each type of product.
And that’s where the multichannel seller’s pain shows up. Every dashboard — Amazon, MercadoLibre, your 3PL, Shopify — shows you a different number, none of them account for shared inventory, and to read the bands for real you have to export everything to a spreadsheet, reconcile availability against sales, and do it before the data changes. In the sections below you’ll see what each band means, where to draw the cutoffs by category, and how real time turns that reading into something you check at a glance.
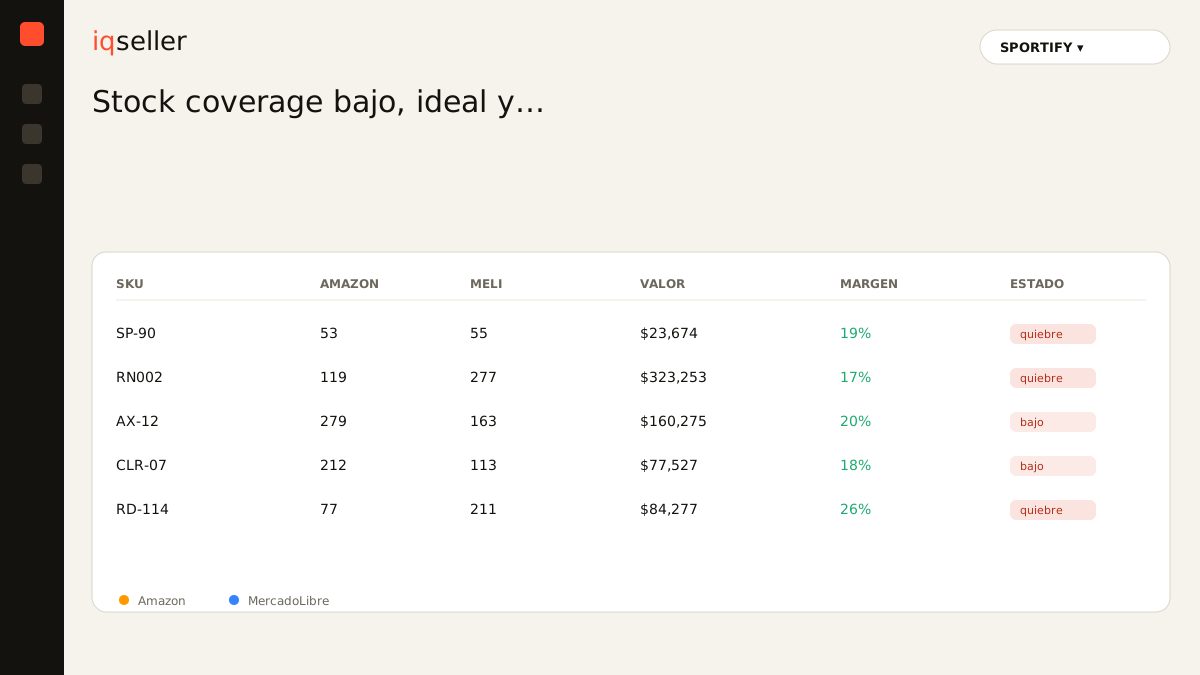
what the number you’re reading actually measures
Before interpreting bands, you need to be clear on what the number measures. Stock coverage is how many days of sales your current inventory covers, and it comes from dividing the units you can sell today by your average daily sales. If you have 200 pieces and sell 8 a day, your coverage is 25 days.
The detail that makes or breaks the reading is “available.” It isn’t your total warehouse inventory: it’s real availability, already net of reserved, damaged, and receiving-quarantine units. If you read the bands off physical totals, your number is inflated and you’ll think you’re in the ideal band when you’re actually brushing against the low one. This whole guide assumes coverage is calculated on real availability; otherwise none of the bands mean what they should.
The other input, average daily sales, is calculated over a time window — 7, 14, or 30 days — depending on how stable the product is. Changing the window moves the number and, with it, the band. That’s why the bands aren’t fixed values you copy from a blog: they’re ranges you define with your own lead times and your own turnover.
the low band: when the number screams replenish
The low band has immediate consequences, so let’s start there. Stock coverage is in the low zone when it drops below your replenishment lead time — the days it takes from placing an order to having the goods ready to sell.
The logic is direct: if it takes you 15 days to replenish and your coverage falls to 15, any delay — from the supplier, from customs, from receiving at FBA — leaves you out of stock. That’s why the low-band cutoff isn’t a pretty round number, it’s your lead time. A SKU with a 7-day lead time can live comfortably at 10 days of coverage; an imported item with a 45-day lead time is already in the red at 40.
Most disciplined sellers don’t wait to hit the exact lead time: they add a safety buffer and fire the order when coverage reaches lead time plus a few extra days. That buffered threshold is exactly what’s worked out in detail in critical stock and how to set the threshold for each SKU: the point where the coverage reading stops being informational and becomes mandatory action.
And here’s a multichannel trap. The same product can have healthy coverage on Amazon and be in the low band on MercadoLibre if sales accelerate on one channel and inventory is shared. Reading the low band per isolated channel fools you; you have to read it against combined sales and total availability. Crossing those criteria wrong is the number-one cause of a stockout that a seller “didn’t see coming” even though the number was right there on screen.
the ideal band: the healthy zone you want to live in
The ideal band is a range, not a point. The floor is your replenishment threshold (lead time plus buffer) and the ceiling is the maximum number of days you want sitting idle before inventory starts costing more than it contributes. For many normal-turnover SKUs, that band lands between roughly 30 and 60 days, but the exact range depends on your category.
The key thing about the ideal band is that you’re not trying to maximize coverage, you’re trying to keep it inside the range. Coverage that hugs the floor exposes you to stockouts on any demand spike; coverage that hugs the ceiling starts locking up capital. The healthy zone is the middle, where you have room to absorb a strong weekend without running short and without leaving product to sit for months.
The width of the ideal band depends on two things: demand volatility and lead time. A product with even demand and fast replenishment can have a narrow band and live near the floor without drama. A product with jumpy demand — from promotions, seasonality, the real-time inventory you watch move hour by hour — needs a wider band and a higher floor, because the buffer has to absorb those jumps.
The practical way to work with this band is to define it per product type and let the system alert you when a SKU leaves it, below or above. As long as coverage stays inside the ideal band, you don’t have to do anything: that’s exactly the signal that inventory is doing its job.
the excess band: when inventory stops working
The other extreme gets ignored more than it should. A very high stock coverage — 90, 120, 180 days — isn’t “being well stocked,” it’s a silent problem. That inventory is frozen capital generating no sales, it takes up space you pay for, and on marketplaces with long-term storage fees it costs you money directly every month it sits.
The excess band reads worse the faster your catalog changes. A product with obsolescence risk — fashion, electronics, anything with versions — loaded to 150 days of coverage is a candidate for a forced markdown or for getting stuck with it. That’s why the excess cutoff isn’t universal: for a stable consumable, 90 days can be acceptable; for a short-cycle product, 60 is already too much.
There’s a legitimate case for high coverage, and it’s worth recognizing so you don’t confuse it with excess: pre-season buying. If you deliberately raise coverage before a big sales event because you know demand will multiply, that high number is a decision, not an oversight. The difference between excess and foresight is whether the high coverage responds to real, dated future demand, or whether you simply over-ordered and the product is now sitting.
For the multichannel seller, spotting the excess band by hand is nearly impossible, because tied-up capital hides across channels: units spread over FBA, the 3PL, and Full that, summed against sales that have cooled, produce a sky-high coverage no single dashboard shows you consolidated.
why the bands change by category
By now it’s clear there are no universal bands. It’s worth seeing the three factors that move the cutoffs, because they’re what you use to define your own bands per product type.
The first is lead time. It sets the floor for everything. A long lead time pushes up both the low-band cutoff and the ideal-band floor, because you need more buffer days to avoid running short during replenishment. A short lead time lets you live with tighter bands.
The second is demand volatility. A product that sells evenly tolerates narrow bands; one that jumps needs wide bands and higher floors. It helps here to calculate coverage with two windows — one 7-day and one 30-day — and watch for when the short one drops well below the long one: that’s a sign demand is accelerating and your real band is worse than the long average suggests.
The third is the cost of holding the product: storage, obsolescence risk, and the opportunity cost of the capital. The more expensive it is to hold inventory idle, the lower you should set the ideal-band ceiling and the sooner the excess band kicks in. A cheap, stable product tolerates high coverage; an expensive, perishable one doesn’t.
With those three factors you define a simple table: for each product type, what’s the low cutoff, what’s the ideal range, and where excess begins. That table is what turns the raw number into an actionable reading, and it’s the same logic that feeds critical stock alerts so you never react late.
reading the bands in real time, not in Monday’s spreadsheet
Defining the bands is an exercise you do once and adjust now and then. Reading them happens every hour, for every SKU, on every channel, and that’s where manual work becomes impossible. Coverage moves on its own: every sale lowers it, every arriving replenishment raises it, every shift in demand pace reshuffles which band each product falls into.
That’s exactly the problem solved by having inventory in real time and consolidated. Instead of exporting three or four dashboards every morning, reconciling availability against sales, and classifying by hand what’s in the red, each SKU shows its live stock coverage and its current band: low, ideal, or excess, already calculated on real availability and the combined sales of all your channels. When a product crosses from ideal to low, you see it in the moment, not once it’s already out of stock. When a product has spent weeks in excess, it surfaces instead of hiding across channels. Reading days of inventory stops being a Monday chore and becomes a traffic light that’s always on.
Reading stock coverage well is the difference between operating by bands — replenishing when it’s time, freeing capital when there’s a surplus — and operating by scares, discovering the stockout when a customer already couldn’t buy from you and the excess when the storage bill arrives. You can work out the number on a napkin; placing it in its correct band, for your whole catalog and in real time, is what actually protects your operation.