
Fill rate and account reputation: when a stockout becomes a visibility problem
October 19, 2026
Most sellers treat a stockout as a lost-sales problem: the product ran out, I stopped billing for a few days, the container landed and we went back to normal. That reading underestimates the damage by a factor that is hard to quantify and easy to feel: the marketplace does not forget. What you lost was not only the days without inventory, but the ranking position that took months to build and the piece of your reputation that got stained by the orders you could not fulfil.
The metric that organizes all of this is called fill rate, and it comes from the supply chain world: what share of what was ordered from you could be served out of available inventory. It is an old, well defined metric with established benchmarks, for manufacturers supplying retail chains. Applied as-is to a marketplace seller it breaks at one very specific point: the demand you could not serve is invisible, because when you run out of stock the listing gets paused and the order never comes into existence.
That does not make the metric useless; it makes it something you have to build differently. And it is worth building, because on Amazon and MercadoLibre availability stopped being a warehouse topic a long time ago: it is a direct input into the algorithms that decide whether you get shown at all.
This post covers what fill rate measures, which version of that number you can actually calculate from your own data, what ranges to expect, and how it connects to MercadoLibre’s thermometer and to Amazon’s account health.
what fill rate is and why the textbook definition does not transfer
The classic definition is units shipped from available inventory divided by units ordered over a period. Its close cousin is OTIF, on time in full, which additionally requires the complete order to arrive within the committed date. Fill rate measures availability; OTIF measures availability plus schedule.
Both were born in B2B relationships, where the customer sends you a purchase order for 500 units and you ship 430. There the denominator exists, it is signed, and it can be audited. On a marketplace that denominator disappears: if your listing is out of stock, nobody orders anything from you. The buyer sees a paused listing, or never sees it at all because search stopped surfacing it, and buys from someone else. No record survives saying “I asked and you could not deliver”.
That is why the useful question is not “what is my fill rate” but which version of fill rate can I measure with the data I actually have. There are three, and each answers something different.
the three versions of the number, and which one you can really calculate
One. Order fill rate. Of the orders that did come in, how many did you ship complete. This one you can calculate: the numerator is orders shipped, the denominator is orders received, and the difference is the ones you cancelled because you did not have the unit. If you received 620 orders in the month and cancelled 11 for lack of stock, your order fill rate is 98.2%. This number matters far more than it looks, because each of those 11 cancellations carries a direct consequence for your reputation on both marketplaces.
Two. Availability, or in-stock rate. What share of the time your SKUs were genuinely available to sell. It is calculated in SKU-days: with 40 active SKUs and a 30-day month, your universe is 1,200 SKU-days. If 7 SKUs were out of stock for an average of 9 days each, that is 63 SKU-days at zero, and your availability is 94.75%. This is the version that best replaces the classic fill rate, because it measures exactly what the marketplace penalizes.
And here is the adjustment that makes it serious: weight it by revenue. If those 7 SKUs represent 22% of your sales, a flat 94.75% is hiding a much bigger hole. The weighted version, SKU-days out of stock multiplied by each SKU’s share of sales, usually comes out several points worse, and it is the one that reflects the real damage.
Three. Demand fill rate. Units that would have been ordered from you against units you could serve. This one cannot be measured, only estimated: you approximate it by taking sales velocity from the days before the stockout and projecting it across the days without stock. It is an estimate, not a fact, and it has to be presented that way. It is useful for sizing lost sales and justifying a purchase, not for reporting as if it were data.
Glossary: stockout, when the listing has nothing left to sell →what range is healthy, and why the benchmarks you will find are not yours
Searching for fill rate benchmarks returns a fairly consistent range, and it is worth saying where it comes from. Public supply chain material, American and European, measured on relationships between suppliers and retail chains, puts typical fill rate between 85% and 95%, with top performers between 98% and 99%. For OTIF, the same material treats anything above 95% as excellent, and documents that large chains like Walmart or Target hold suppliers to thresholds near 98%, with financial penalties for missing them.
None of that is a benchmark for a Mexican marketplace seller. Those are contractual B2B relationships, with formal purchase orders, in other markets and with a different structure. There is no equivalent publication for Amazon Mexico or MercadoLibre sellers.
What can be said honestly is this: on a marketplace the implicit standard is higher than in B2B, not lower. A supplier who serves 92% of what was ordered can negotiate with their customer; a seller who cancels 8% of orders for lack of stock negotiates with nobody, they lose reputation, lose exposure and in the extreme lose the account. Which is why the reasonable target for order fill rate is not 95% but as close to 100% as you can get, and the real debate sits in availability, where you do have to decide how much capital you want tied up to sustain it.
The useful baseline is your own: calculate your weighted availability for the last three months and set next quarter’s target a few points above it. That is worth infinitely more than comparing yourself against a number from another industry and another country.
how Amazon charges you for it: in-stock rate, IPI and account health
Amazon does not ask you for a fill rate, but it measures its components and uses them to decide how much inventory you get to send in and how much you get shown.
The Inventory Performance Index (IPI) is the score that summarizes your FBA inventory management. It is built from four components: excess inventory percentage, sell-through rate, stranded inventory and the in-stock rate of your top-selling products. That fourth component is, in practice, your fill rate seen from Amazon’s side: if your main ASINs go out of stock repeatedly, the score drops. In 2026 the threshold Amazon publishes sits at 400 points, and the company reserves the right to adjust it quarterly based on network capacity. Below that threshold come storage capacity limits, which is the most awkward penalty of all: exactly when you need to restock, they cap how much you can send.
Separately there is the Account Health Rating (AHR), a 0 to 1,000 scale where every account starts at 200 points. Above 200 the account sits in green with full privileges; between 100 and 199 it enters a risk zone with required corrective action; below 100 the account becomes a candidate for deactivation. AHR aggregates policy and performance violations, and that is where cancellations and late shipments land. The order defect threshold is covered separately in Order Defect Rate and account health, because it deserves its own detail.
Both scores change their rules fairly often. Before making a purchasing decision on the back of them, confirm the current thresholds in Seller Central, which is the only source that counts.
how MercadoLibre charges you for it: the thermometer and the paused listing
MercadoLibre is more direct, which is why it hurts faster. Its reputation is calculated over a rolling 60-day window and is built from three factors: claims that went to mediation, sales cancelled by the seller, and shipments dispatched late. The result is painted on a five-color thermometer, from red to green, and that color decides your exposure in search, your eligibility for promotions and even access to certain logistics benefits.
The connection to inventory is immediate: a sale you cancel because you did not have the unit is not a lost sale, it is a negative reputation event, and it carries weight inside that 60-day window. Selling what you do not have is worse than not selling at all. That is the point that is hardest to internalize when you come from thinking in terms of lost sales.
The second consequence is exposure. When stock hits zero, MercadoLibre pauses the listing automatically to avoid sales that cannot be fulfilled. A paused listing keeps its history, visits, questions, prior sales, but it stops appearing in search, and while it is out, the visits and sales in that category go to other sellers. When it comes back, it competes against listings that never broke their rhythm. Restocking fast is not a best practice, it is how you protect something you already built.
Glossary: reorder point, the level that triggers the purchase →from the stockout to the purchase order: the full chain
Fill rate is an outcome, not a lever. The levers sit upstream, and they are three numbers you should hold per SKU and per channel.
- Sales velocity. How many units a day the SKU moves, measured over a window that reflects current demand and not the annual average. It feeds everything else.
- Real lead time. Not the one your supplier promised: the one that actually elapses between placing the order and the unit being available to sell, including customs, transit, receiving at FBA or Full and check-in time. That last leg is the one sellers most underestimate and the one that causes the most stockouts.
- Reorder point with a buffer. Velocity times lead time, plus safety stock sized by how variable that SKU’s demand is. A stable product needs little buffer; one that depends on a campaign needs plenty.
With those three, forecasting stops being a hunch. And there is one multichannel detail that breaks more restock plans than you would expect: the reorder point is not a single number. A SKU living in FBA, in Full and in your own warehouse has three different replenishment times and three different velocities, and calculating one number for all three guarantees that one channel runs dry while another holds excess. Reorder point per channel works through that case.
fill rate and availability in iqseller
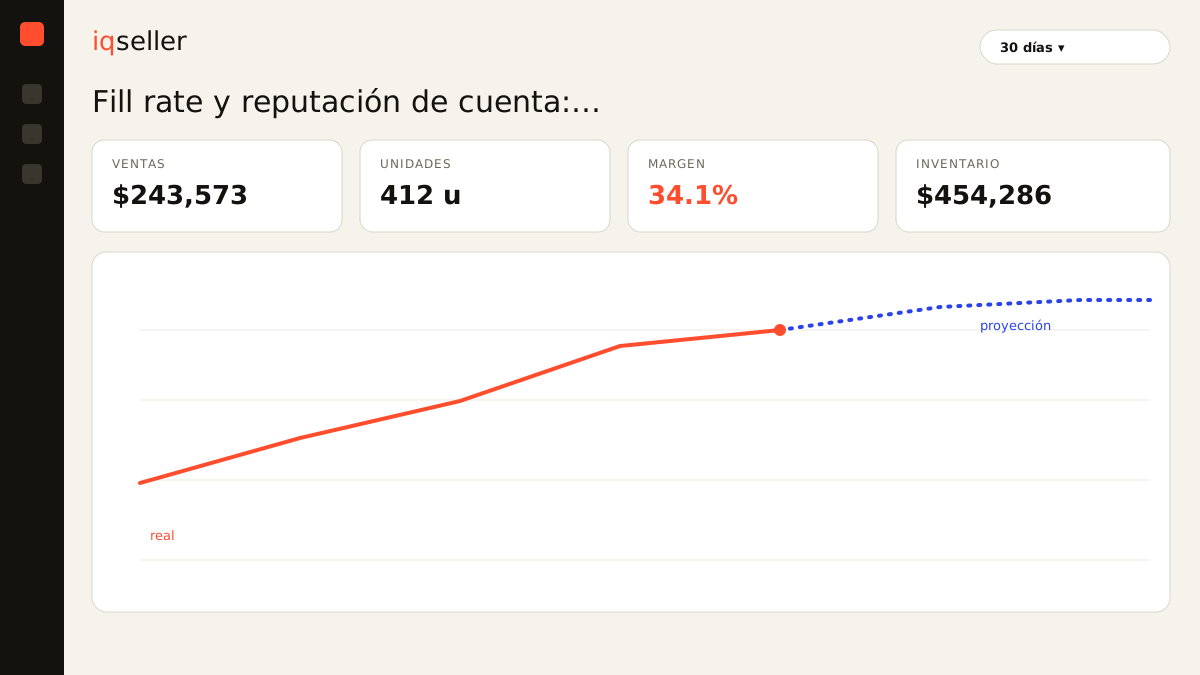
The panel does not have a button labelled fill rate, but it holds the three pieces the number is built from, which is what is usually missing.
The Inventory module consolidates the stock that is yours wherever it sits, FBA, Full, your warehouse, your 3PL, and keeps it aligned with what each channel publishes. That is the basis of the availability rate: without a single view of real inventory, calculating SKU-days out of stock is an exercise in spreadsheets and memory. The Forecast module takes sales velocity and the loaded lead time to project when each SKU hits zero, per channel, which is the actionable version of the same problem: instead of reporting the stockout, it anticipates it.
Alerts is where this turns into operations: it flags when a SKU crosses its critical threshold or when sales velocity accelerates enough to pull the stockout date forward. Profitability adds the other half of the decision, the half that usually gets made wrong: how much net margin per SKU is at stake if that product goes dark, with COGS, commissions, FBA and Full fees, shipping and VAT deducted. A stockout on a thin-margin SKU and one on the SKU carrying the month’s profit do not deserve the same urgency, and without that number beside them the two look identical in the list.
And the Parent → Model → SKU tree lets you read availability by family: one size out of stock out of twelve is not the same as the size that concentrates half the sales, even though in a flat SKU count they weigh the same.
the minimum dashboard for not reacting late
Five numbers, reviewed weekly:
- Order fill rate for the period: orders shipped divided by orders received. Every cancellation for lack of stock, named individually.
- Revenue-weighted availability, not the flat one. The contrast between the two tells you whether your stockouts are landing on products that matter.
- Days of coverage per SKU and per channel, sorted low to high. Anything below its own lead time is already in trouble even if units remain.
- Reputation and account health: the thermometer color on MercadoLibre and the Seller Central indicators on Amazon, with the cut-off date of their rolling window.
- Estimated lost sales from the period’s stockouts, always labelled as an estimate, to support the conversation about how much capital is worth tying up.
What this dashboard changes is not the warehouse operation: it changes the conversation. It stops being about whether “we ran out again” and starts being about how many points of availability each additional peso of inventory buys, which is a question that has an answer.