
Inventory Turnover: What Range Is Healthy and How to Read It per Product
September 25, 2026
Almost every seller has a best-sellers list within reach. Very few have a list of the products that return their invested cash the fastest. They are not the same list, and confusing them is one of the reasons a business can grow revenue two years in a row and still not have the cash to pay its supplier.
Inventory turnover is the metric that separates those two lists. It does not measure how much you sell: it measures how many times a year your inventory turns into sales and gets bought again. A product that turns twelve times a year is handing your capital back every month. One that turns twice a year hands it back every six months, and during those six months that money is not available for anything else: not for the product that is actually moving, not for ads, not for surviving a peak season.
The usual problem is that the number lives on no dashboard. Amazon shows you units and sales. MercadoLibre shows you its own. Your warehouse and your 3PL keep their own counts. The cost of your goods lives in none of the three, because that figure belongs to you and your supplier. Getting a real turnover figure means crossing average inventory, cost of goods sold and a time window, with every channel added together — and that ends up in the same spreadsheet as always, done by hand, late, with two-week-old data.
This post is about calculating it properly, what range makes sense for the kind of product you sell, and why the comparison almost nobody runs — turnover against margin — changes how you decide what to reorder.
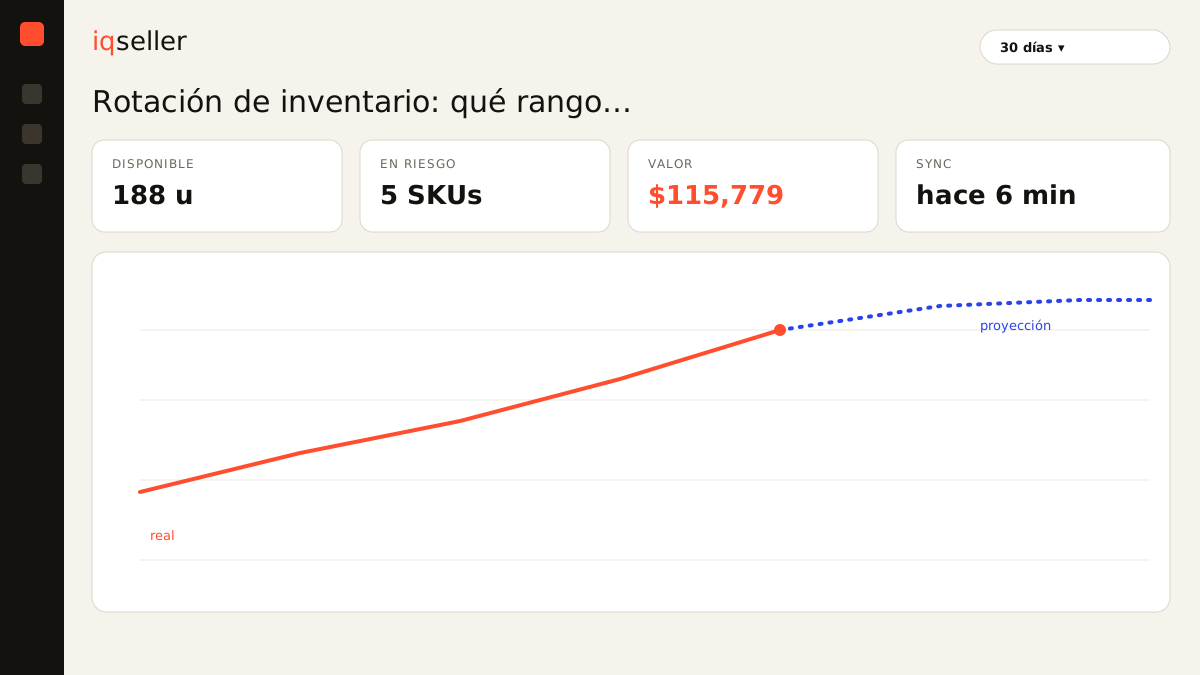
what inventory turnover is and how it is calculated
The standard formula is turnover = cost of goods sold in the period ÷ average inventory valued at cost. Both halves have to be in the same accounting currency: cost against cost. That is the detail most people get wrong.
If you sold merchandise that cost you 2,400,000 pesos over the year, and your average inventory valued at cost was 400,000 pesos, your turnover is 6. Six times a year your entire warehouse emptied and refilled. Divide 365 by that turnover and you get the days one turn takes: 61.
The per-SKU version is more useful for buying decisions, and it can be done in units, which is easier to get: units sold in the period ÷ average units on hand. If you sold 1,200 pieces of a SKU during the year and your average on-hand was 100 pieces, that product turned 12 times. As long as you use units consistently in both the numerator and the denominator, the result matches the one you would get in cost pesos.
“Average inventory” is the second place the metric gets distorted. Taking only the closing balance of the period is convenient and almost always wrong: if you closed the month right after receiving a container, your average inventory inflates and your turnover comes out artificially low. Averaging the opening and closing balances is the bare minimum; averaging weekly or daily snapshots is far more faithful, especially in categories with strong seasonality.
And one warning that matters for multichannel: average inventory has to include all the stock that is yours, wherever it sits. What is in FBA, what is in Full, what is in your warehouse, what is at the 3PL, and what is in transit and already paid for. Leave inbound inventory out and your turnover looks better than it is, because that capital already left your account even though it is not sellable yet.
turnover, days of inventory and coverage: three views of the same thing
Worth clearing up before going further, because these three get confused constantly and they do not answer the same question.
Glossary: days of inventory, the countdown on your stock →Turnover looks backward and is a capital-efficiency metric: how many laps your money ran in a period that has already happened. Days of inventory looks forward and is an operational metric: with the stock I hold today and the sales pace of the last few days, how long until I hit zero. Coverage is the same idea as days of inventory, expressed in weeks and usually read per channel.
The arithmetic link is direct: 365 divided by annual turnover gives you the average days one lap took during the measured period. If a product turned 6 times, a lap took about 61 days. But that 61 is a historical average, not a forecast. If demand shifted last month, today’s days of inventory can be 20 even though your historical turnover says 61.
That is why all three coexist. Turnover helps you decide which products you want your money sitting in. Days of inventory and coverage help you decide when and how much to order of each one. Look only at the first and you buy well but run out; look only at the last two and you never run out but end up with capital buried in long-tail SKUs. Days of inventory covers that second reading in detail.
what range is healthy, and why it depends on the product
Here honesty matters: neither Amazon nor MercadoLibre publishes turnover benchmarks by category for Mexican sellers. What circulates publicly in 2026 are compilations of industry reports and public-company financial filings, built almost entirely on retail and ecommerce in the United States, Canada, the United Kingdom and Europe. Those compilations group ranges running roughly three to five turns a year in home goods and furniture, four to seven in fashion, four to six in electronics, and twelve or more in high-frequency consumables such as food and beverage. Other compilations from the same year, measuring against sales instead of cost, report considerably higher retail averages.
The fact that the figures disagree with each other is not an accident: they depend on whether the calculation runs on cost or on retail price, on how average inventory is defined, and on which companies made it into the sample. The only thing that survives all that material is the general shape, not the exact numbers: a consumable turns fast, a piece of furniture turns slowly, and fashion turns on its season rather than on the calendar month. Use it as an order of magnitude, and as an argument for not benchmarking your catalog against another seller’s — not as a target.
The logic behind that general shape is solid, and you can apply it to your catalog with no external data at all:
- Low ticket, frequent repurchase: expect high turnover. The customer comes back, demand is stable, and the risk of dead stock is low.
- High ticket, long consideration: expect low turnover. You sell fewer pieces, but each one carries a margin that compensates.
- Seasonal: annual turnover is misleading. A holiday product can turn four times measured across twelve months and fifteen times measured across its own season. Measuring a seasonal SKU on a yearly window makes you believe it is a bad product.
- Perishable, dated or with a yearly version: turnover stops being a preference and becomes a requirement. If the product expires, the minimum turnover is the one that empties the lot before the date.
how to set your own baseline when there is no benchmark
If there is no reliable external figure, the only baseline that helps is your own. And building it is easier than it sounds.
First, calculate trailing twelve-month turnover for every SKU and sort it high to low. Your own catalog hands you the reference immediately: the median of your products is your “normal,” the top quartile is what actually works in your business with your suppliers and your lead times, and the bottom quartile is the list that has to be explained or liquidated.
Second, do not compare SKUs from different families. Compare within the same family or category, because that is where the number means the same thing. A charger against another charger, not a charger against a suitcase. Cutting the analysis by product family and season is exactly what makes turnover comparable.
Third, remeasure every quarter and keep the history. The trend in your own turnover tells you far more than any industry average: if a SKU went from turning 9 to turning 5 across two quarters, you have identified a problem, even if that 5 still looks “acceptable” against any published table.
Fourth — and almost nobody does this — measure turnover per channel. The same SKU can turn 10 on Amazon and 3 on MercadoLibre, or the other way around, because demand, search position and competition differ on each side. If your number is a single consolidated figure, the slow channel hides behind the fast one and you keep shipping inventory into a warehouse where the product does not move.
high turnover on a thin margin against low turnover on a fat one
This is the comparison that gives everything above its point, and the one that usually gets resolved by instinct instead of arithmetic.
A seller’s intuition says the higher-margin product is the better product. The arithmetic says what matters is how much profit each peso of invested capital generates per year, and that is margin multiplied by turnover, not margin on its own.
An example with invented but consistent numbers. Product A sells for 300 pesos, costs you 200, and after commissions, fulfillment fees, shipping and ads leaves 40 pesos of net margin per unit: 13 percent. It turns 12 times a year on an average on-hand of 100 pieces, meaning 1,200 pieces a year. Annual profit: 48,000 pesos. Average capital tied up: 100 pieces at 200 pesos of cost, so 20,000 pesos.
Product B sells for 900 pesos, costs you 600, and leaves 150 pesos of net margin per unit: 17 percent, clearly the better percentage. But it turns 2 times a year on the same average on-hand of 100 pieces, meaning 200 pieces a year. Annual profit: 30,000 pesos. Average capital tied up: 100 pieces at 600 pesos, so 60,000 pesos.
Product A returns 2.40 pesos of annual profit per peso of parked capital. Product B returns 0.50. The “worse margin” product is three times the better business per peso invested, and on top of that it frees cash twelve times a year instead of twice, which lets you reinvest without borrowing.
Glossary: inventory valuation, how much capital is parked →The conclusion is not “always prefer high turnover.” It is that a margin percentage only means something once you multiply it by how many times a year you collect it. A low-turnover product earns its place when its absolute margin is large enough to make up for the laps it does not run, when it anchors an entire category, or when it is the entry point for a customer who then buys your consumables. What is never justified is keeping it because “the margin looks nice” without having done the multiplication.
the expensive side of high turnover
If high turnover were free, the whole catalog would have to be high turnover. It is not, and saying so keeps you from reading the metric naively.
Very high turnover means your inventory sits permanently near the floor. That leaves almost no room for error: any supplier delay, any receiving problem at a fulfillment center, any demand spike turns into a stockout. And the stockout does not only cost those days of sales. On Amazon the sales history feeds placement, and recovering the traction of a listing that spent two weeks out of stock costs more than the sales you missed.
There is a logistics cost too. Turning fast in small lots means more purchase orders, more inbound shipments, more receiving, and less volume leverage with your supplier. Sometimes high turnover is being paid for with express freight and worse supplier pricing, and that already came out of your margin before you saw it.
The correct reading is that high turnover is good as long as your lead time can keep up with it. If your supplier takes 45 days and your product turns every 30, you do not have an efficient product: you have a product that will be out of stock for part of the year. The fix there is not to lower turnover; it is to raise safety stock or change the replenishment scheme, as covered in reorder point with variable demand.
the mistakes that distort the number
Five of them, in order of frequency.
- Calculating on retail price instead of cost. Divide sales at list price by inventory valued at cost and your turnover comes out inflated by your entire margin. It is the most common error and the reason two sellers comparing numbers are usually not discussing the same thing.
- Using closing inventory as if it were the average. It gives you a snapshot of the least representative day of the period, which is normally right before or right after a large receipt.
- Leaving out in-transit inventory or another channel’s stock. That capital is already committed. If you do not count it, your turnover lies in your favor.
- Mixing windows. Twelve months of sales divided by an average inventory built from three months of snapshots does not produce annual turnover; it produces a meaningless number.
- Reading one consolidated figure. A 400-SKU catalog with an average turnover of 6 can be made of 60 products turning 15 and 340 turning 2. The average is healthy; the business is not.
how turnover reads in iqseller
In iqseller turnover is not a separate report: it comes out of crossing data that already lives in the Inventory and Profitability modules.
The Inventory module consolidates stock from Amazon, MercadoLibre, your warehouses and your 3PL into one view, with in-transit flagged separately, and it keeps inventory valuation using the COGS you loaded per SKU. That COGS is what allows turnover to be calculated on cost rather than on selling price, which is the difference between a comparable number and a decorative one.
The Profitability module supplies the other half: net margin per SKU, already net of Amazon settlement commissions, MercadoLibre order commissions, FBA and Full fees, shipping, advertising, and the VAT and withholding breakdown. With that margin and that turnover in the same table, the comparison from the example above stops being a spreadsheet exercise and becomes an ordered list of products by return on invested capital.
The Parent → Model → SKU tree matters more here than it looks. A parent product can show perfectly healthy turnover while two of its sizes have not moved in eight months. Seeing turnover at SKU level, and being able to roll it up to model and parent, is what stops you from restocking dead sizes because the product “generally” sells well. And the Alerts module keeps that diagnosis from depending on someone opening the report: the SKU that drops below your own baseline surfaces on its own.
closing thought
Inventory turnover is, in the end, the question of how many times a year your money goes to work. It does not replace margin or days of inventory — it completes them. Margin tells you how much you make each time; turnover tells you how many times you make it; days of inventory tell you whether you will reach the next lap without running empty.
And since no reliable turnover benchmark exists for Mexican marketplaces, the baseline that counts is the one you build from your own catalog, measured per SKU, per channel and per quarter, with real cost loaded and the full inventory counted. One number of your own, properly calculated and tracked over time, is worth more than any industry average borrowed from another market.