
Selling More but Earning Less: How to Catch It in Time
August 27, 2026
You just closed the best quarter in your business’s history. Units are up, average order value held, you opened a new channel, and the sales charts on all three dashboards point up and to the right. And yet, when you look at the bank account, the money isn’t there. You’re not in the red — it’s that profit didn’t grow anywhere near as fast as sales did, and nobody on the team can explain exactly why.
This is probably the most common and worst-diagnosed problem for the multichannel seller in Mexico. It almost always gets blamed on something temporary: “it was Hot Sale month,” “we poured a lot into ads,” “it’ll normalize in October.” Sometimes that’s true. But many other times what’s happening is structural: the business grew along a path that dilutes margin on every turn, and growth itself became the problem.
The uncomfortable part is that this decay doesn’t arrive all at once. It arrives in fractions of a percentage point per month, spread across six different line items, and none of those line items looks bad on its own. By the time it surfaces in the annual result, you’ve been running for three or four quarters on a cost structure that doesn’t work. This article is about seeing it earlier.
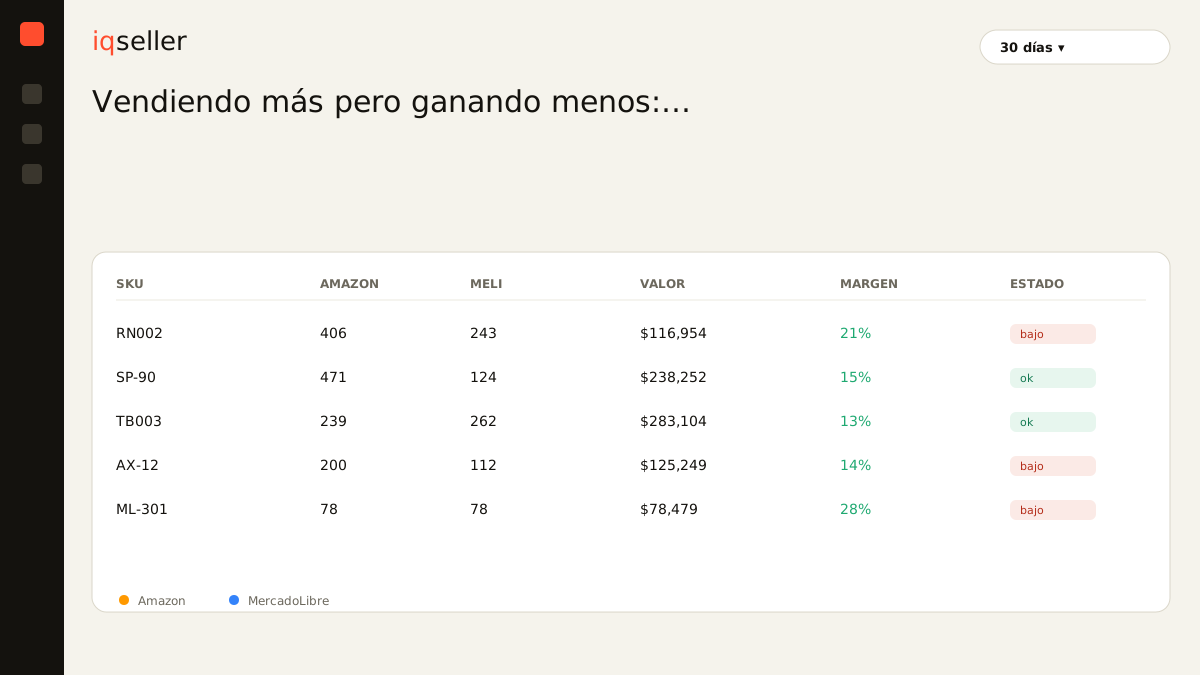
why growing can shrink your profit
Intuition says selling more should leave more, because fixed costs spread across more orders. That’s true for fixed costs. The problem is that on a marketplace nearly all of your cost is variable, and several of those variable costs get worse as you grow.
Four mechanisms do the damage, almost always working at the same time:
The mix degrades. When you push volume, volume arrives through whatever is easiest to sell: cheap entry products, with more competition and less margin. Your catalog didn’t change, but the proportion did. If your $300 products went from 30% of your orders to 55%, your average margin dropped even though no individual product became less profitable.
Advertising gets more expensive. The first pesos of ad spend buy your cheapest demand: people who were already looking for you. As you scale budget, you buy progressively colder and pricier traffic. A campaign that started at 8% ACoS doesn’t stay at 8% when you triple the investment, and that drift is rarely measured against the margin of the product it’s financing.
Returns scale faster than sales. More volume means more new buyers, less familiar with your product, buying with less information. The return rate of a mature product with repeat customers is not the return rate of that same product pushed by advertising to a cold audience.
Logistics gets complicated. You grew, and now you hold inventory in Full, in FBA and in your own warehouse, with transfers between all three, more frequent restock shipments, and units that move twice before selling. Every movement costs money and none of it shows up as “product cost.”
Glossary: real net margin, with everything deducted →the arithmetic of growth that makes you poorer
It’s worth seeing with numbers, because in the abstract it sounds like theory and in the concrete it’s brutal.
A business in its baseline month:
- 400 orders, average order value of $850 → $340,000 in sales
- Average contribution margin: $170 per order
- Contribution profit: $68,000
Six months later, after a serious growth push:
- 900 orders, average order value of $790 → $711,000 in sales, a +109%
- But the mix shifted toward entry products, ads went from 4% to 11% of sales, returns climbed from 6% to 11%, and inter-warehouse restocking doubled
- Average contribution margin: $92 per order
- Contribution profit: $82,800, a +22%
You doubled sales and profit grew by a fifth. And that’s before touching fixed costs, which over that same period almost certainly rose: more people, more software, more space. It’s entirely possible that this business is making less money in absolute terms than six months earlier, with twice the operation, twice the risk and twice the capital tied up in inventory.
The point isn’t that growing is bad. It’s that growing without watching contribution per order is betting blind that scale will save you.
the four signals that show up before the problem
The decay is detectable long before it reaches the income statement, if you know what to look at. These are the signals, in the order they usually appear:
One: your average order value falls while units rise. That’s the fingerprint of a degrading mix. If you sell more units but the ticket drops, your growth is coming from cheap products, and those are almost never the ones leaving the most margin.
Two: your ad spend grows faster than your sales. Don’t just look at each campaign’s ACoS; look at TACoS, total ad spend against total sales. If last month ads were 6% of your sales and this month they’re 8%, you just gave away two points of margin without a single campaign looking bad.
Three: your return percentage rises two months in a row. A return doesn’t only cost the refund: it costs the commission you already paid, the outbound freight, the return freight, the unit that comes back unsellable and someone’s time processing it.
Four: your inventory grows faster than your sales. That’s the signal that growth is being financed with immobilized capital. It can be healthy — if you’re building for a season — or it can mean you’re buying product that turns badly.
None of the four requires a sophisticated system. They require being looked at every month, together, and compared against last month rather than against last year.
why monthly net margin hides it from you
Here’s the methodological trap that lets this problem survive so long undiagnosed: monthly net margin is an average, and averages hide exactly the kind of damage we’re describing.
If your net margin went from 14% to 12%, that can mean very different things. It could be that your entire catalog dropped two points evenly — a cost problem, relatively easy to attack. Or it could be that half your catalog is still at 18% and the other half collapsed to 5%, and what you’re looking at is the average of two different businesses living inside the same account. The number is identical; the diagnosis and the remedy look nothing alike.
Worse: monthly net margin is calculated at close, once everything has already happened. It’s a forensic report. It tells you what killed you, not that you’re dying. To decide whether to scale or brake, you need the signal per order and per SKU, available while the month can still be corrected.
what to track instead
The metric that answers this question is contribution margin per order: what each order leaves after subtracting only the costs that order caused — product cost, channel commission, fulfillment, shipping, its share of returns, and attributable advertising. No prorated rent, salaries or software.
Its virtue is that it answers the question net margin cannot: does this additional order make me money or cost me money? If contribution per order is positive and stable, growing is good, full stop. If it’s been falling month over month, every new order brings you closer to the point where volume stops compensating and starts costing.
And because it’s calculated per order, it can be grouped however you want: by SKU, by model, by channel, by campaign. That’s where the useful answer appears, and it’s almost never “the business is doing badly” but rather “these eleven SKUs that make up 40% of my orders leave $18 of contribution and are financing the entire operation with your time and your capital.”
Glossary: inventory valuation, how much capital is tied up →how this looks in iqseller
The Profitability module is built around exactly this question. It doesn’t start from the shelf price but from the base excluding VAT, and against that base it deducts the COGS you uploaded, each channel’s actual commission taken from the settlement, fulfillment fees, shipping and advertising. Out of that comes contribution and net margin, per SKU and grouped in the Parent → Model → SKU tree.
What changes the conversation isn’t having the number, it’s having it compared against itself over time. An 11% margin says nothing on its own; an 11% margin that was 17% three months ago, on a SKU that now accounts for triple the orders, is a complete diagnosis. That’s the reading a hand-built spreadsheet never gives, because nobody reconstructs six months of per-SKU history by hand every month.
Placed next to channel mix and average order value, the panel shows the full chain: where volume grew, what happened to the margin of that volume, and whether the net result of that combination was a gain or a loss.
five questions for every month’s close
If you take one thing from this article, make it this routine. Five questions, fifteen minutes, once a month:
- Did my average order value rise or fall versus last month, and why?
- What percentage of my sales went to ads this month, against the previous one?
- How many of my top-20 SKUs by volume are below my target contribution?
- Did my inventory grow more or less than my sales?
- Is absolute profit — pesos, not percentage — higher than three months ago?
If the fifth answer is “no” and the four before it explain why, you already have the diagnosis. The remedy is almost never to sell less: it’s usually to prune the SKUs that don’t contribute, cut the advertising that buys unprofitable volume, and raise price where the market tolerates it. But none of those three decisions can be made without the per-product number in front of you.
Growing is fine. Growing without knowing what each point of growth costs you is how a healthy business ends up with twice the sales and half the air.