
ACoS and margin: why looking at ACoS alone can wreck your profit
August 20, 2026
In the acos vs margen matchup, margin always wins, and here’s the short reason: ACoS only tells you what share of an ad-driven sale’s revenue went to clicks, but it has no idea what the product cost you, what the category referral fee took, what you paid in fulfillment, or how much went to tax. That’s why a 15% ACoS can leave you profit on one SKU and lose you money on another with the exact same 15%. If you look at ACoS alone, you’re measuring spend efficiency against gross revenue, not against what you actually keep.
Put another way: ACoS is an advertising metric; margin is a business metric. Comparing them in isolation gets you nowhere. The only useful reading is to cross them: subtract ad spend from your real net margin, SKU by SKU, and see what’s left. When you run that cross, plenty of products that looked “healthy” with a pretty ACoS turn out to be selling below the point where they start costing you money.
The catch is that this cross almost never lives in one place. Your Amazon Ads spend is in one tab, your referral fee in another, your cost of goods in a separate catalog, your 3PL fulfillment in an email, and your MercadoLibre sales in yet another dashboard with its own logic. So you end up building a spreadsheet at eleven at night to answer something that should be instant: is this ad earning me profit or eating it?
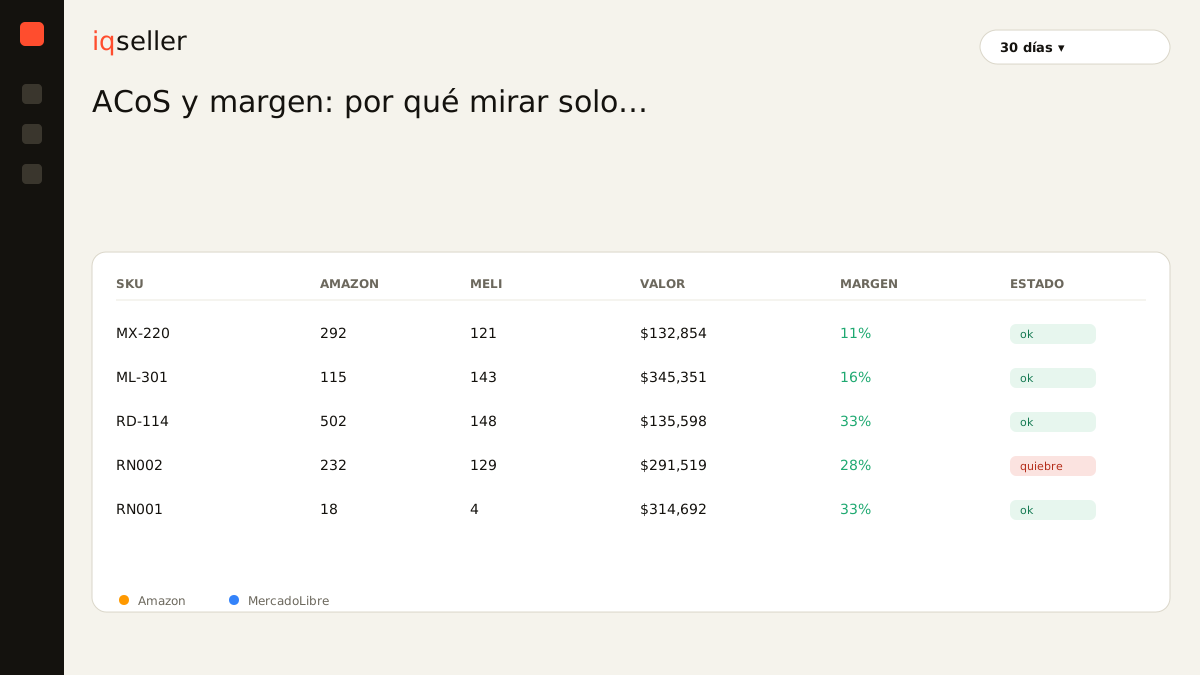
what ACoS measures and what it ignores entirely
ACoS (Advertising Cost of Sales) is ad spend divided by the sales attributed to that advertising. You spent $1,000 and those ads generated $6,000 in sales: your ACoS is 16.7%. It sounds like profitability, but it isn’t. It’s spend efficiency over revenue, and nothing more.
What ACoS does not know is the entire list of costs that separate the selling price from your profit: cost of goods, the category referral fee, the fulfillment fee, inbound shipping, returns, and tax. All of that already ate into the price before ad spend ever shows up. ACoS behaves as if the selling price were your profit, when in reality your profit is a much thinner slice. That’s exactly why the same ACoS is excellent on a product with 45% gross margin and ruinous on one with 18%.
why the same ACoS wins or loses depending on the product
Picture two SKUs, both at 20% ACoS. The first has 40% margin before advertising: after subtracting that 20%, it keeps 20 points of profit. The second has 22% margin: after the same 20%, it keeps barely 2 points, which a single return or a fee adjustment wipes out completely. Same ACoS, opposite stories. The number that decides isn’t the ACoS: it’s the margin you had before you spent it.
This is precisely what the acos vs margen comparison makes visible. ACoS gives you the cost; margin gives you the cushion. Without the cushion, the cost means nothing. And that cushion varies wildly across your catalog: high-rotation, low-fee products absorb a lot of investment; high-fee, low-ticket products run out of air at an ACoS that would be trivial on another SKU.
Glossary: ACoS is ad spend divided by the sales attributed to those ads; it measures spend efficiency, not profit.break-even ACoS: your real red line
To know whether an ACoS is good, you first need your break-even ACoS: the exact percentage where you stop earning and start losing. It comes from the margin you have before advertising. If after referral fee, fulfillment, cost, returns, and tax you keep 28% margin on the price, that 28% is your ceiling. A 25% ACoS on that SKU leaves you 3 points; a 30% one loses money, even if it sounds “reasonable” in a report.
Here’s the multichannel seller’s trap: your break-even is not the same on Amazon and MercadoLibre for the same product. Fees differ, fulfillment differs, and sometimes pricing does too, because you compete against a different seller on each channel. A 24% ACoS can leave you profit on MELI and lose you money on Amazon at the same time. Look at a single dashboard and that asymmetry is invisible. That’s why it pays to read advertising alongside your per-channel cost and alongside the automatic price calendar: when the price moves up or down, your break-even ACoS moves with it, and a campaign that was profitable yesterday can stop being profitable today without you touching a single bid.
the two silent ways advertising eats your margin
The first is subsidizing: you bid high on crowded generic terms, drive traffic, convert, but at an ACoS above your break-even. Sales climb in the report and profit drops in the bank. You scale up exactly the product that loses the most per unit, convinced it’s “working” because it sells more.
The second is cannibalization: you pay for ads on keywords where you already ranked organically. The customer was going to buy from you anyway, but now you’ve slapped a click cost on top. That campaign’s ACoS looks gorgeous —it converts beautifully, of course, because it’s often your own brand— and it still cuts into net margin on sales you already had for free. Catching either one requires having real margin next to ACoS, SKU by SKU. Neither lives in Amazon’s campaign tab or MercadoLibre’s: they live in the cross you usually rebuild by hand.
Glossary: real net margin is what’s left after ALL costs —product, fees, shipping, returns, tax, and advertising—, not just price minus cost.the hidden cost of crossing acos vs margen in Excel
The real problem isn’t missing data: it’s that data is scattered and each channel names it differently. To answer “which SKU is losing to advertising?” you download reports, match SKUs that are named differently on Amazon and MELI, prorate costs, hand-enter the 3PL fulfillment, and build a formula you hope has no reference error. By the time you finish, the answer is already yesterday’s.
And in advertising, deciding with yesterday’s data is expensive: campaigns don’t wait for your spreadsheet, they keep spending on last week’s bids. Every day you take to notice a SKU crossed its break-even is a day overpaying. A single real-time source of truth changes the question from “how much did I spend?” to “did this spend earn me profit today?”, and lets you see the effect of raising or lowering a bid on net margin, not just on ACoS. It’s also worth revisiting the exact meaning of ACoS so you never mistake an efficiency metric for a profit metric.
what you should see at a glance, per SKU and per channel
A dashboard that truly governs the relationship between advertising and profit shows you, for each SKU and each marketplace, at least this: real net margin before advertising, calculated break-even ACoS, current ACoS, and net profit after subtracting ad spend. With those four columns together, the decision stops being intuition. You instantly see which products can take more investment because they have cushion to spare, and which are already in the red even though their ACoS looks decent.
That reading talks to the rest of the business. An ACoS that jumps suddenly may be no fault of the campaign but of a conversion that dropped because you ran out of stock on your best-selling color: fewer attributed sales at the same spend inflate ACoS without anyone touching a bid. That’s why margin, advertising, and your real available stock have to live on the same board. When they do, the cause jumps out instead of hiding across three tabs.
Glossary: real available stock is sellable inventory net of reserves and in-transit units; if it drops, your conversion falls and your ACoS rises without the campaign changing at all.the decision that actually matters
Optimizing advertising is not chasing the lowest possible ACoS. A very low ACoS sometimes means you’re underinvesting and leaving profitable sales on the table. The goal isn’t to minimize ACoS: it’s to maximize total net profit. That sometimes means accepting a higher ACoS on a good-margin product to win profitable volume, and cutting bids mercilessly on a thin-margin one that can’t take it.
That decision is only possible when you see margin and advertising in the same place, in real time, with your SKUs unified across Amazon, MercadoLibre, and your 3PL. ACoS without margin is half the story; margin without ACoS is the other half. Together, and up to date, they answer the only thing that matters in the acos vs margen debate: how much money each dollar you put into ads truly left you. iqseller exists so that cross is already done before you open the spreadsheet, not after.